introduction
"there are three kinds of lies: lies, damned lies,
and statistics" - Disraeli
Many people working in CSCW have had some formal statistics training
or have used statistics in practice. They may perfom experiments or
gather data themselves, read or review other's work or teach others
about CSCW. This tutorial aims to complement their experience, concentrating
instead on the understanding of randomness and common statitstical concepts.
randomness
It's easy to forget just how random the world is. We know that
things won't come out exactly at their average value, but think they won't
be far out. Even with a long standing knowledge of random phenomena, I
still get surprised sometimes at how far from uniform things are. In this
first part of the tutorial, we'll try some experiments to see random phenomena
at - raindrops falling on the plains of Gheisra
and coin tossing races.
We are very good at finding patterns in data ... so good, we even
see patterns when none are there. Often experimental results are misinterpreted
because randomly occurring patterns are regarded as indications of real
underlying phenomena.
Over uniform results have usually not occurred by chance, but instead
because of some systematic effect or human intervention. Statisticians
have re-analysed Mendel's results which established genetic inheritance
and also the experiment which established the fixed electron charge.
In both cases the results were too good to be true. A systematic process
had been at work - the experimenters had discarded those results which
disagreed with their hypothesis. In fact, the results they discarded
would have been simply the results of randomness making some experiments
run counter to the general trend. This is quite normal and to be expected.
So, don't try to fiddle your results - you will be found out!
pdf slides (128K)
finding things out
Randomness causes us two problems. First, as we discussed in
the last section, we may see patterns that aren't there. But also, if
there are patterns in the world, we may fail to see them. The job of statistics
is to help us see through this randomness to the patterns that are really
in the world
The primary way this is done in statistics is to use large numbers
of things (or experimental trials) and different forms of averaging.
As one deals with more and more items the randomness of each one tends
to cancel out with the randomness of others, thus reducing the variability
of the average.
The advantages of averaging are based on the cancelling out of randomness,
but this only works if each thing is independent of the others. This
condition of independence is central to much of statistics and we'll
see what happens when it is violated in different ways. 
Averaging on its own is not sufficient. We have to know what is the
right kind of averaging for a particular problem. Then, having found
patterns in the data, we need to be sure whether these are patterns
in the real world, or simply the results of random occurrence. We'll
look at these issues in more details in the rest of the tutorial.
pdf slides (129K)
measures of average and variation
Even for straightforward data there are several different common
forms of averaging used. Indeed, when you read the word 'average' in a
newspaper (e.g. average income) this is as likely to refer to the median
of the data as the mean. Actually, the reason the arithmetic mean is so
heavily used is due as much to its theoretical and practical tractability
as its felicity!
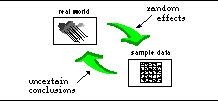
Statistics does a strange sort of backwards reasoning, we look at
data derived from the real world, then try and extract patterns from
the data in order to work out what the real world is like. In the case
of means, we hope that the mean of our collected data is sufficiently
close to the 'real' mean to be a useful estimate. We know that bigger
samples tend to give better estimates, but in what sense 'better'.
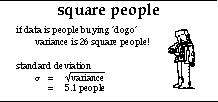
 In statistics, better usually means 'less variation'. Again there is
no single best measure 'variation', but the most common solutions are
the inter-quartile range, the variance and standard deviation (
 ).
Of these the first is useful, but not very tractable, the second is
very tractable (you can basically add up variances), but is hard to
interpret, and the last both reasonably tractable and reasonably comprehensible
- that's why ).
Of these the first is useful, but not very tractable, the second is
very tractable (you can basically add up variances), but is hard to
interpret, and the last both reasonably tractable and reasonably comprehensible
- that's why  is
normally quoted! is
normally quoted!
We'll have a look at the square root rule for how averages get 'better'
as estimates and also at the problem of how to estimate variation -
a different sort of averaging.
pdf slides (115K)
proving things
Many reported experiments in HCI and CSCW journals (and other
disciplines) end up with a statistical significance test at 5%: if it
passes the result is 'proved', if it fails - well ... we'll come back
to that!
Proof in statistics is about induction: reasoning from effects back
to causes. In logic this is the source of many fallacies, but is essential
in real life. The best one can say in a statistical proof is that what
we see is unlikely to have happened by chance. Although you can never
be entirely certain of anything, you can at least know how likely you
are to be wrong. A 5% significance means that you are wrong one time
in twenty - good enough?
Significance tests only tell you whether things are different. They
don't tell you whether the difference is important or not. Some experiments
may reveal a very slight difference others may have such high variability
that even a huge difference would not be statistically significant.
Understanding the relationship between variability, real underlying
differences and statistical significance is crucial to both understanding
and designing experiments.
Disturbingly often academic papers in HCI and CSCW use a lack of significance
to imply that there is no underlying effect. In fact, you can never
(statistically) prove that things are identical. Statistical insignificance
does NOT prove equality!! The proper way to deal with equality is a
confidence interval which puts bounds on how different things are.
pdf slides (143K)
design and test
There are two enemies to statistical proof. First is variability
- the results may be lost in the randomness. The second is aliasing -
the results you measure (and check to be statistically significant) are
actually due to some other cause.
The first problem, variability, is to some extent intrinsic and in
the final analysis can only be dealt with by increasing the number and
size of experiments as we have discussed in previous parts. However,
some of the variability may be due to factors not intrinsic to the thing
being measured: in HCI and CSCW experiments principally differences
between people. If such factors are randomly allocated, they may not
affect the overall result, but will certainly increase the effective
variability.
The second problem, aliasing, is even worse. These additional factors
may give rise to spurious results if, for example, all the most expert
users try out one design of software.
Careful experimental design can fix, randomise or cancel out these
additional factors. Hence reducing the likelihood of aliasing and making
it more likely that real differences will show up as statistically significant.
Finally, having run an experiment, if you then use the wrong statistical
test, then at best real differences may be missed or at worst apparently
significant results may in fact be spurious.
pdf slides (57K)
experiments in HCI and CSCW
Experiments in HCI and CSCW involve that most variable of all
phenomena, people. The great danger in any experiment in HCI and CSCW
is that the results are analysed at the end and no statistical conclusion
can be drawn. We'll discuss how to avoid this disaster situation. This
influences the choice of what to measure as well as the way experiments
and constructed and analysed. Furthermore, it is often impossible to use
sufficient subjects to obtain statistical results. We'll discuss how to
combine different kinds of experimental data - quantitative, qualitative
and anecdotal - in order to make sure that even small experiments have
a useful (and publishable!) output.
pdf slides (27K)

|
 |

|